This monitoring project was inspired by a YouTube video by Everlanders, where they used electronics to monitor their solar production and battery state. We ultimately took a slightly different technical approach from them. The implementation details are not the same, but the overall objectives are quite consistent. We want to know that everything in our truck is working well, and let us know when they aren’t.
This is a three part series. In this part we introduce our early prototyping activities to establish the underlying technologies and overall approach. In the second part, we consider what shall be monitored. In the last part ,we get into the details of the final configuration and more implementation details.
Just like the Everlanders, it all started with monitoring of the solar panels. Our batteries seemed to be under-performing, but maybe the problem was with the solar panels. We could not really tell what was going wrong. So, we added a little monitoring so we could see how much electricity we make and how much each day. Adding this monitoring was a huge success, and it was not long before we worked out we needed bigger batteries and more solar.
We realized that monitoring could help in other areas, and over time we would think of new things to monitor. To make sure this monitoring monster does not grow out of control, we had one important design requirement:-
- None of the monitoring gadgetry should interfere with the enjoyment of our home. It all has to be hidden away quietly doing its job, allowing us to access it when we want to. It should enhance our travel experiences but not distract us.
We ultimately ended up creating a fairly robust monitoring solution, that is able to monitor all sorts of devices and sensors in Molly. Mostly the monitoring will work without us needing to do anything. We wanted the system to be as automatic as possible. However, there are a few manual activities, for example, when we fill up with diesel fuel.
Basic Design
Conceptually the monitoring system consists of four basic components:
- The things that produce measurements. These will be called the sensors, and range from simple things like a temperature sensors to more complex devices like the Engine Control Unit (ECU) of the FUSO truck.
- The software that connects the sensors to the computer and processes the sensor information into a standardized form for storage. Node-red is the software we chose to mediate between the sensors and the database. In database parlance, this would be called the ETL layer, where ETL stands for Extract, Transform and Load.
- The sensor measurements are stored in a database, and more specifically a time-series database. For our application we went with a lightweight database called influxDB.
- Lastly the information in the database needs to be visualized into a display. We wanted the display to look good and be very flexible, we settled on Grafana as our main historical visualization software. We use node-red dashboards for real-time visualization.
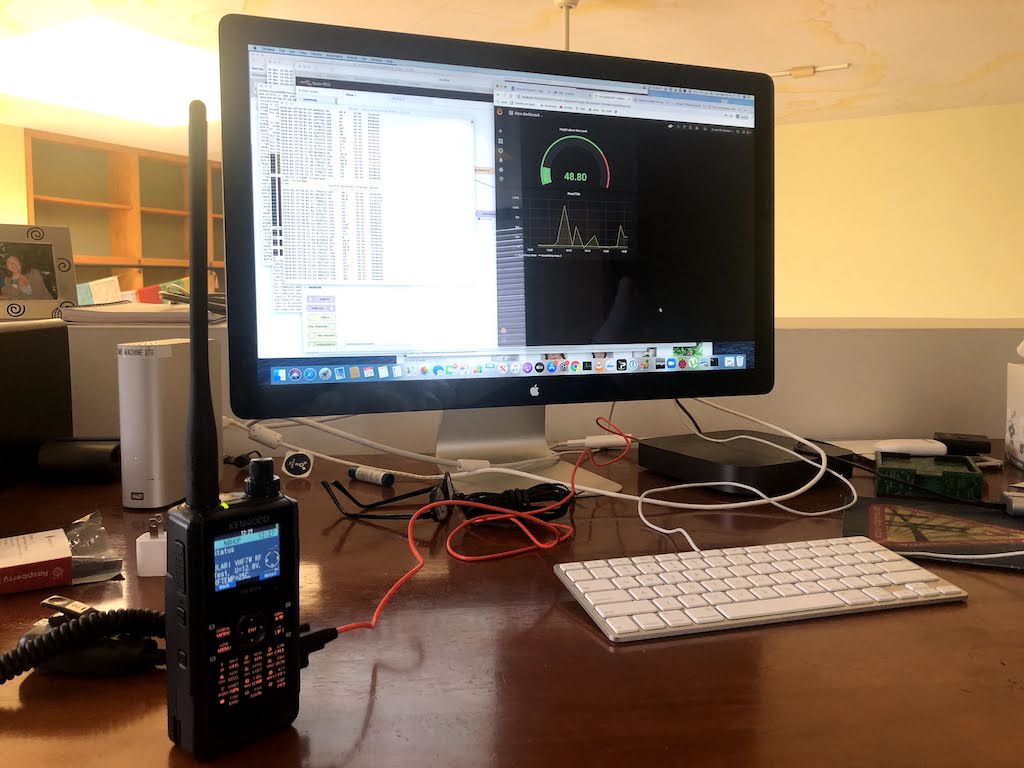
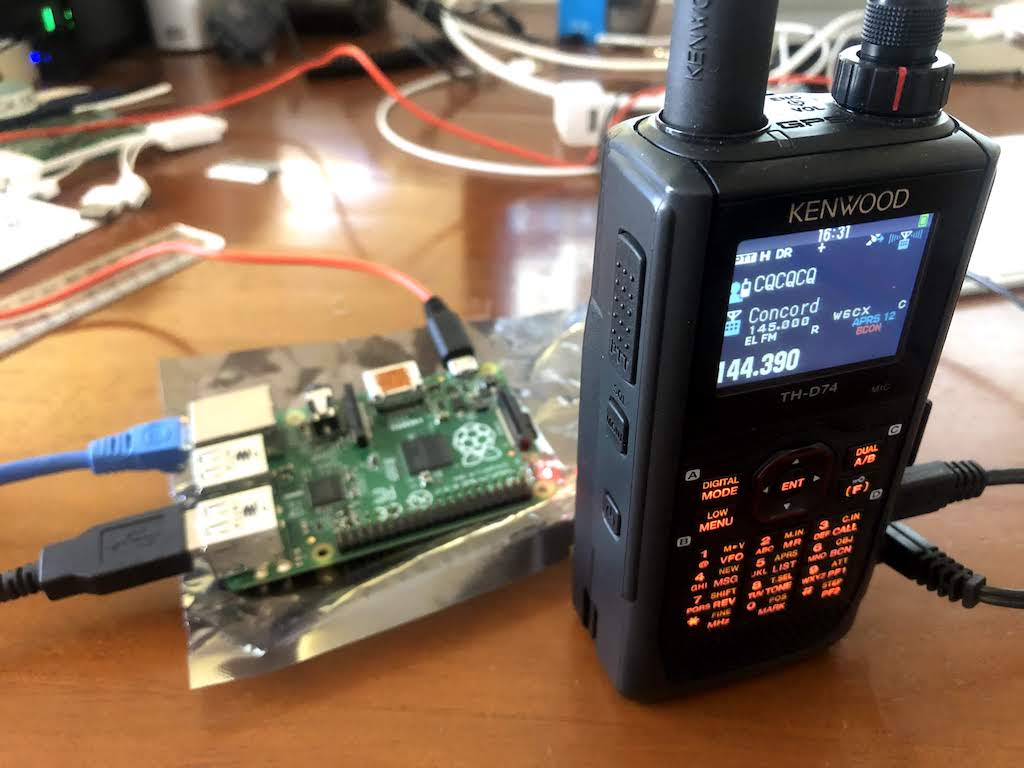
The first step in any project is making sure the idea will work and sort out any fundamental issues with the design. So, spent a morning installing all of the software and playing around. For this early prototyping and proof-of-concept testing, we used our HAM radio as our first sensor. The HAM radio was connected to our Mac computer where the messages were processed and then stored in the database and ultimately visualized.
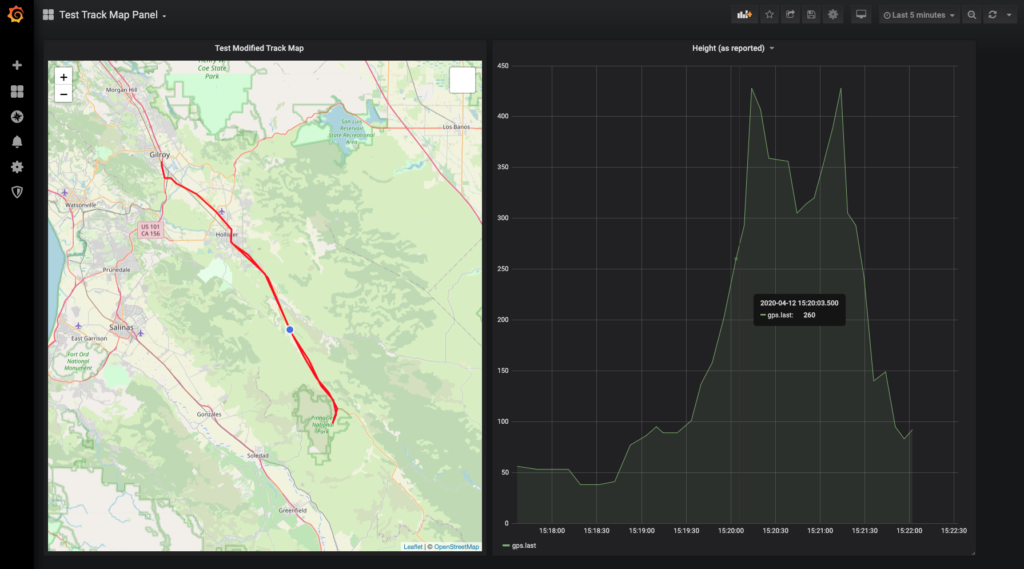
Our HAM radio can receive GPS messages from other HAM radios. Using a serial connection the HAM radio can send GPS information to the Mac computer, which extracts the height above sea level and this height is what will be displayed. This prototype is not really related to monitoring solar generation or batteries or anything to do with Molly, but regardless, it was used to test the approach. Things were working well, and it was not long before we purchased a smart shunt made by Victron. This smart shunt sensor would be used to monitor the battery and solar generation.
Before getting into all the details of how to install the software, it is worth saying that the approach looked good and the initial testing worked out well. The combination of Node-red, influxDB and Grafana is going to work for us. A few days after the prototype was complete, we decided shift the software off the main computer and add a dedicated Raspberry Pi into the mix. An advantage with the Raspberry Pi is the USB ports, there are 4 in total. This means we can plug sensors into the Raspberry Pi instead of the main computer. But more on that later.
The following is a blow-by-blow of the installation process for the prototype. This was all done on a Mac, but wanted to write it down, as it has it was repeated on the main computer and then again on the Raspberry Pi.
This design is very generic and we believe will flexible enough to allow us to add a wide variety of sensor types and generate interesting visualizations. More on what we monitor in part 2.
Guide to Install the Software
Installing Node-js
The Mac does not have node.js, and this is required for node-red. The node.js website advises to use the following command to install node-js.
curl "https://nodejs.org/dist/latest/node-${VERSION:-$(wget -qO- https://nodejs.org/dist/latest/ | sed -nE 's|.*>node-(.*)\.pkg</a>.*|\1|p')}.pkg" > "$HOME/Downloads/node-latest.pkg" && sudo installer -store -pkg "$HOME/Downloads/node-latest.pkg" -target "/"Which produced the following successfully installation
  % Total    % Received % Xferd  Average Speed   Time    Time     Time  Current
                                 Dload  Upload   Total   Spent    Left  Speed
100 30.2M  100 30.2M    0     0  7324k      0  0:00:04  0:00:04 --:--:-- 7324k
installer: Note: running installer as an admin user (instead of root) gives better Mac App Store fidelity
installer: Warning: node-latest.pkg was signed with a certificate that is not valid for store submission.
installer: Installation Check: Passed
installer: Volume Check: Passed
installer: Starting install
installer: Install 0.0% complete
installer: Install 18.8% complete
installer: Install 26.5% complete
installer: Install 31.7% complete
installer: Install 88.7% complete
installer: Install 100.0% complete
installer: Finished install
Installing node-red
The node-red getting started guide provides information on installing node-red on your local machine. We used the following command
sudo npm install -g --unsafe-perm node-redAnd 15 seconds later had the following result
$ sudo npm install -g --unsafe-perm node-red
...
+ node-red@1.0.4
added 293 packages from 303 contributors in 15.371s
That looks successful. Let’s see if it runs with the command
node-redThis command was successful with the result below. As this is on the mac, no need to start-up automatically on boot-up.
29 Mar 10:00:24 - [info]

Welcome to Node-RED
===================

29 Mar 10:00:24 - [info] Node-RED version: v1.0.4
29 Mar 10:00:24 - [info] Node.js  version: v13.12.0
29 Mar 10:00:24 - [info] Darwin 19.3.0 x64 LE
29 Mar 10:00:24 - [info] Loading palette nodes
29 Mar 10:00:25 - [info] Settings file  : /Users/carolinediericx/.node-red/settings.js
29 Mar 10:00:25 - [info] Context store  : 'default' [module=memory]
29 Mar 10:00:25 - [info] User directory : /Users/carolinediericx/.node-red
29 Mar 10:00:25 - [warn] Projects disabled : editorTheme.projects.enabled=false
29 Mar 10:00:25 - [info] Flows file     : /Users/carolinediericx/.node-red/flows_Our-Computer.local.json
29 Mar 10:00:25 - [info] Creating new flow file
29 Mar 10:00:25 - [warn]

---------------------------------------------------------------------
Your flow credentials file is encrypted using a system-generated key.

If the system-generated key is lost for any reason, your credentials
file will not be recoverable, you will have to delete it and re-enter
your credentials.

You should set your own key using the 'credentialSecret' option in
your settings file. Node-RED will then re-encrypt your credentials
file using your chosen key the next time you deploy a change.
---------------------------------------------------------------------

29 Mar 10:00:25 - [info] Server now running at http://127.0.0.1:1880/
29 Mar 10:00:25 - [info] Starting flows
29 Mar 10:00:25 - [info] Started flows
On the computer in Molly, will likely start node-red as service so it starts up automatically on a reboot. The command to do this is sudo systemctl enable nodered.service
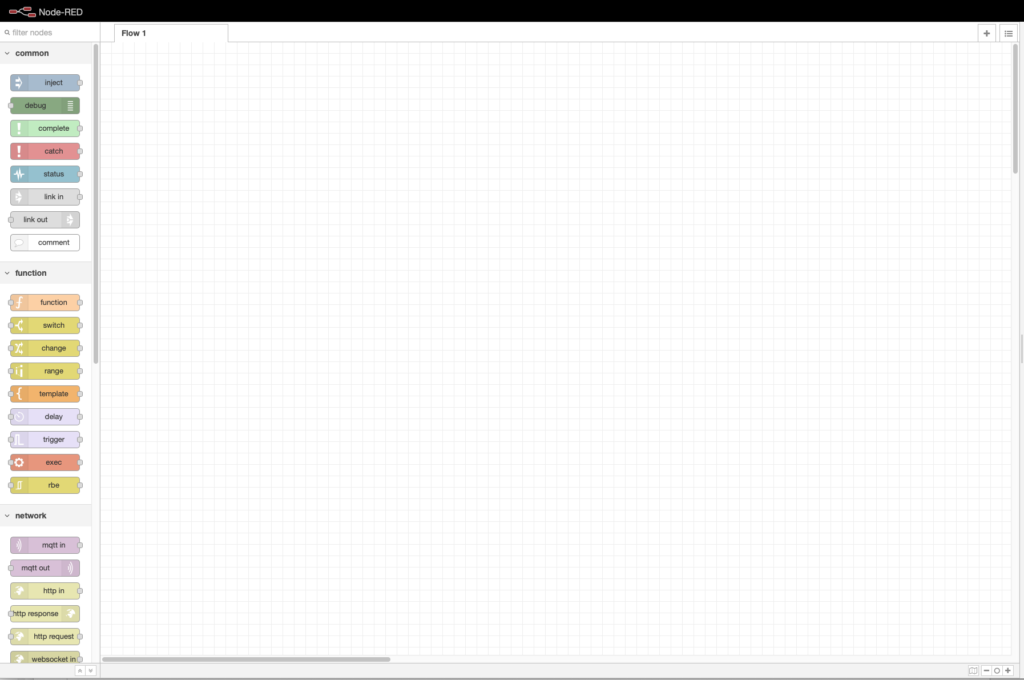
The interface can be accessed at localhost:1880, which was successful
Installing the Serial Port listener
Node-red does not come with a serial port listener as standard. After trying a few different apporaches, the following worked for us
$ cd ~/.node-red
$ npm i node-red-node-serialport
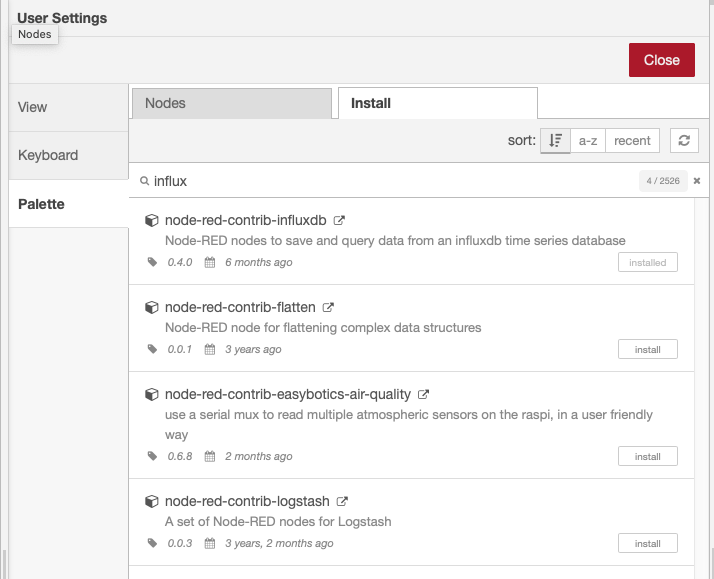
This just resulted in an error, as maybe I was missing the necessary tools to compile the plugin. So, I installed Xcode from Apple. After running the command again, it was successful. But I had to also add via the palette manager in node-red.
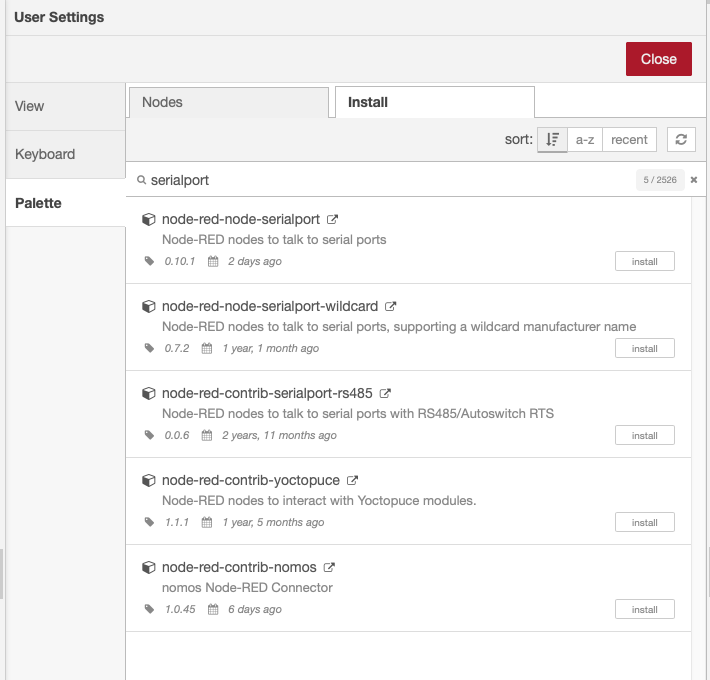
The buttons were added to node-red. Some mild success. I later worked out I needed to add a influxdb node. I did this through the interfave
Installing InfluxDB
InfluxDB is the time-series database. This is installed with home-brew, with the following commands
$ brew update
$ brew install influxdb
Start the InfluxDB with
$ influxdTesting the InfluxDB install as follows with some test data.
$ influx -precision rfc3339
Connected to http://localhost:8086 version v1.7.9
InfluxDB shell version: v1.7.9
> CREATE DATABASE solar
> SHOW DATABASES
name: databases
name
----
_internal
solar
> USE solar
Using database solar
> INSERT batTemp,host=Molly42,type=AGM value=45
> SELECT "host", "type", "value" FROM "batTemp"
name: batTemp
time                       host    type value
----                       ----    ---- -----
2020-03-28T23:40:02.68956Z Molly42 AGM  45
> INSERT houseTemp,country=USA,sensor=hobo external=37,internal=35
> SELECT * FROM "houseTemp"
name: houseTemp
time                        country external internal sensor
----                        ------- -------- -------- ------
2020-03-28T23:43:14.210488Z USA     37       35       hobo
> SELECT * FROM "houseTemp"
name: houseTemp
time                        country external internal sensor
----                        ------- -------- -------- ------
2020-03-28T23:43:14.210488Z USA     37       35       hobo
2020-03-28T23:47:30.606567Z Canada  47       45       hobo
> INSERT houseTemp,country=USA,sensor=hobo external=32,internal=32
> INSERT houseTemp,country=USA,sensor=hobo external=34,internal=37.5
>
Later will need to work out how to automatically start influxDB, probably with
$ sudo systemctl enable influxdb.serviceInstalling Grafana
Grafana is the data visualization tool. There are installation instructions on their website, and we followed these. Again, home-brew was our friend and used to install this software.
$ brew update
$ brew install grafana
Grafana is started with the following command, which should survive a reboot.
$ brew services start grafanaThe Grafana dashboard can be accessed at http://localhost:3000.
Installing MQTT
Most people add a message broker to ease sending of messages around. Mosquitto MQTT seems like a good choice for small computers. The Cradlepoint modem happens to supports MQTT. A simple install with
$ sudo apt install mosquitto mosquitto-clientsAnd to make sure it is running
$ sudo systemctl status mosquittoMaking it all Work
At the moment, neither node-red and influxdb do not automatically start on a reboot. So after a reboot, the following two commands are needed
$ node-red
$ influxd
Also, it all has to work when off-the-grid. So, isolated the computer from the Internet, and all looks good.
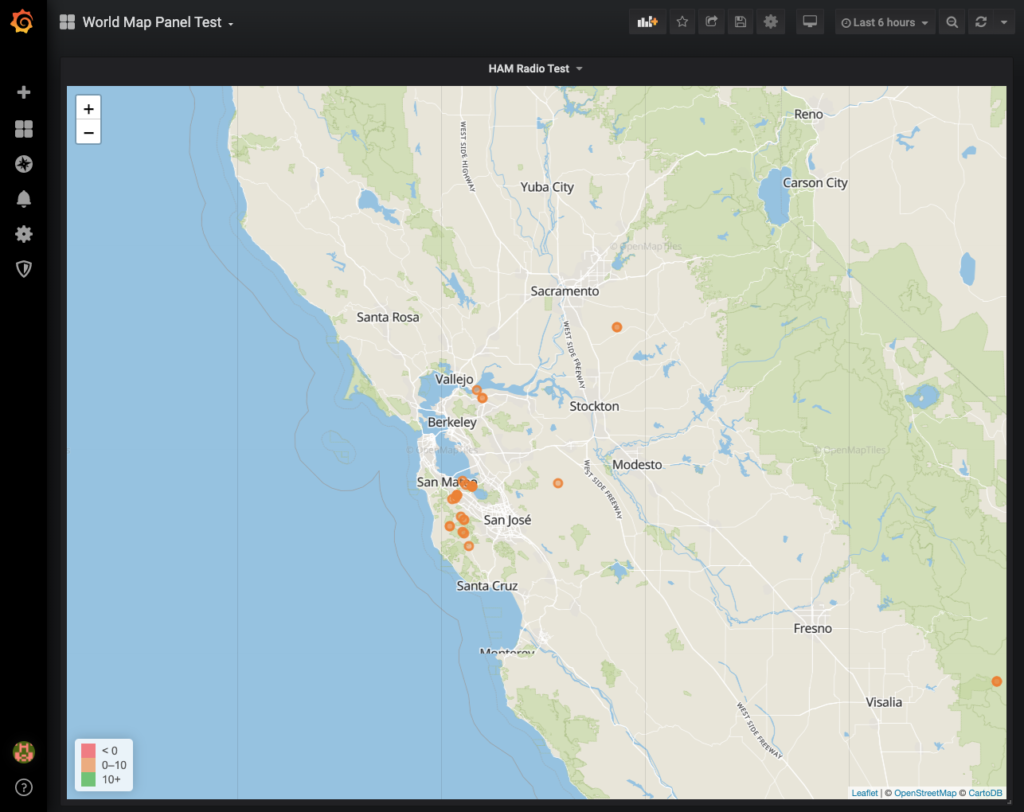
Adding a Worldmap Panel to Grafana
Grafana has this very nice plugin to display geo-tagged information onto a world map. while it is easy to install this plugin, unfortunately it pulls it’s map information from the Internet, which is not ideal for us, as we will not always be connected to the Internet. So, needed to make some small changes to the plugin.
The basemap was changed from CartoDB Dark to maps served from our local tile server, powered by open tile maps. The following line was added to the worldmap.ts function
url: 'http://localhost:32769/styles/klokantech-basic/{z}/{x}/{y}.png'And the stylesheet was fixed with replacing the previous style sheet in worldmap.dark.css with
.worldmap-popup .leaflet-popup-content-wrapper, .worldmap-popup .leaflet-popup-tip {
  background-color: #ECECEC;
  color: #000 !important;
}
With the code changes made, it can be installed with
$ cd /usr/local/var/lib/grafana/plugins/grafana-worldmap-panel
$ brew install yarn
$ yarn install
$ sudo yarn build
$ brew services restart grafana
A very pleasing end result. Now ready to deploy all of this to Molly.
Adding Track Map Panel
The Worldmap Panel is nice, but does not lay down a track based on geo tagged points. The good news, a different plug-in, Track Map Panel, does this. so, with the following commands, got this panel
$ cd /usr/local/var/lib/grafana/plugins
$ git clone --recursive https://github.com/pR0Ps/grafana-trackmap-panel
Of course, this panel also pulls the maps from the imternet, so changed the trackmap_ctrl.js file like above. And then built the panel as per the instructions
$ sudo npm install
$ sudo npm run build
$ brew services restart grafana
I do not have very good test data, but it clearly works.
Raspberry Pi
It did not take long to decide to move everyting over to a Raspberry Pi, freeing up the USB ports on the main computer. Used the guidelines from this website to install node-red. This was so easy I am not even going to describe it here.
Connecting the Victron Energy Smart Shunt
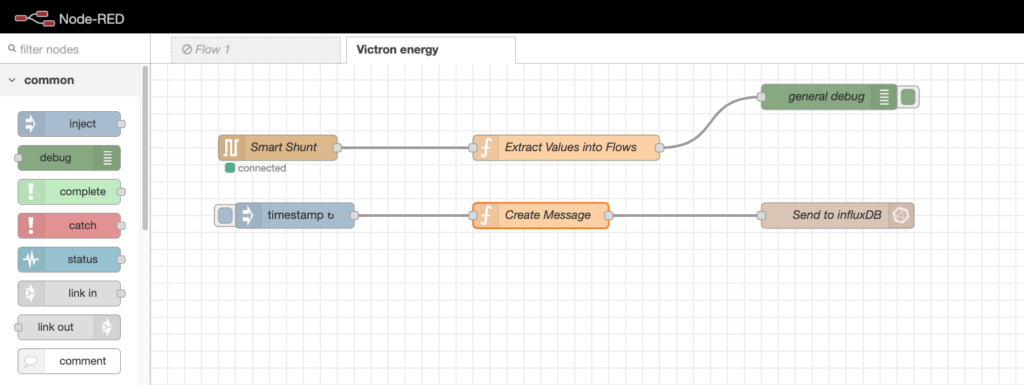
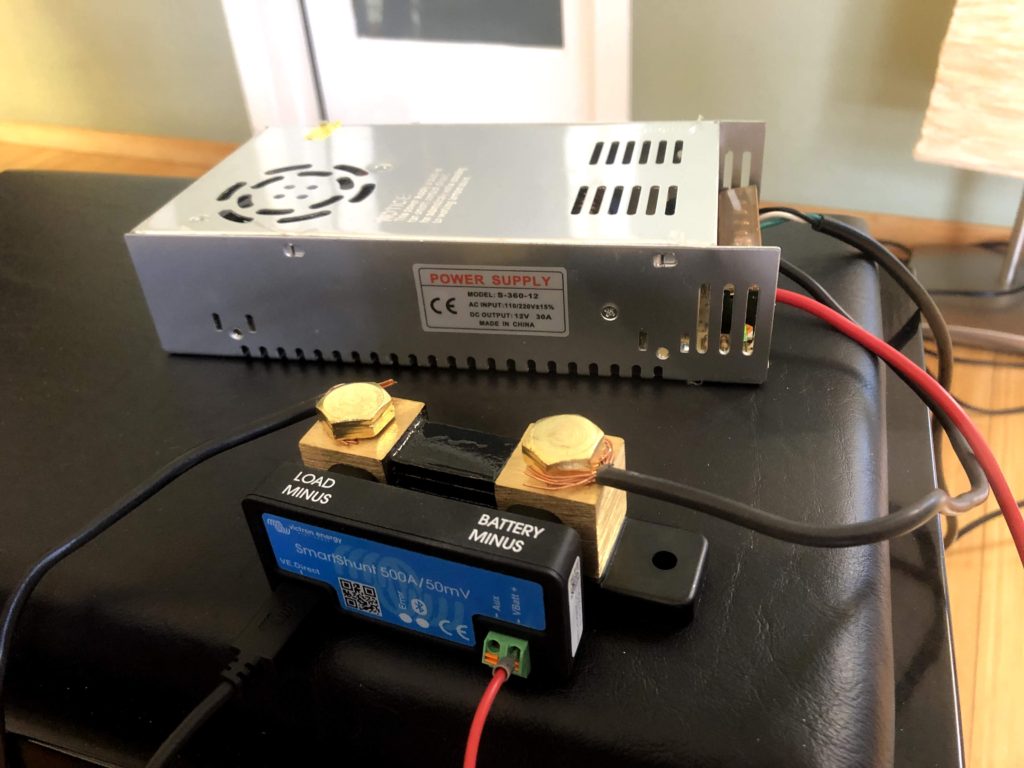
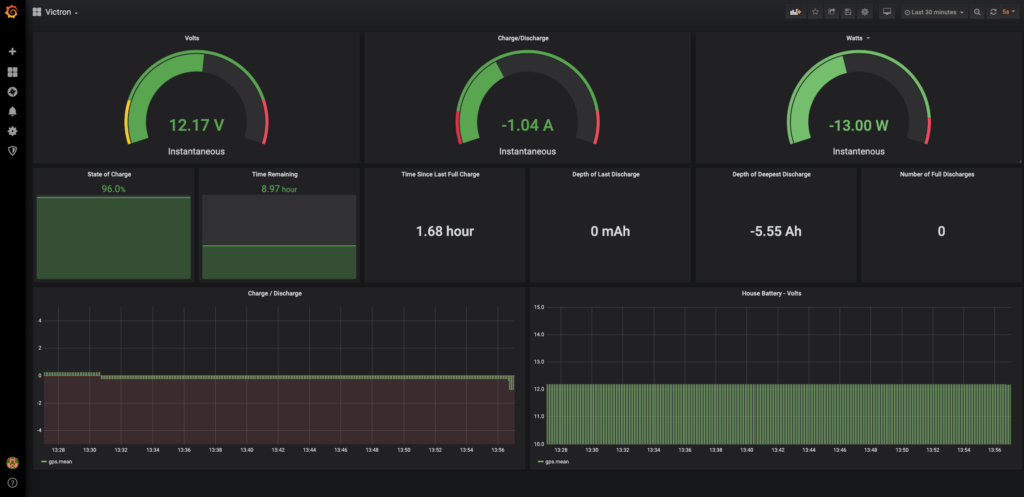
The HAM Radio was a good starting test, but the solution should work with any serial based sensor, like the Victron Energy Smart Shunt. So, found a power supply and load, and wired it up to make sure everything worked fine. After a little programming, looking good.
Conclusion
The core technologies of 1) node-red to process signals from sensors, 2) influxDB to store the sensor readings and 3) Grafana to visualize the readings was a good choice. Later we added 4) node-red dashboards for real-time visualization and 5) mqtt to broker messages around the syste,. On the Raspberry Pi we also use 6) Python for interfacing to the lower level Raspberry Pi hardware, like the bluetooth receiver and attached GPIO boards.

