Iceland > Weather
Please go here for a quick overview of current conditions
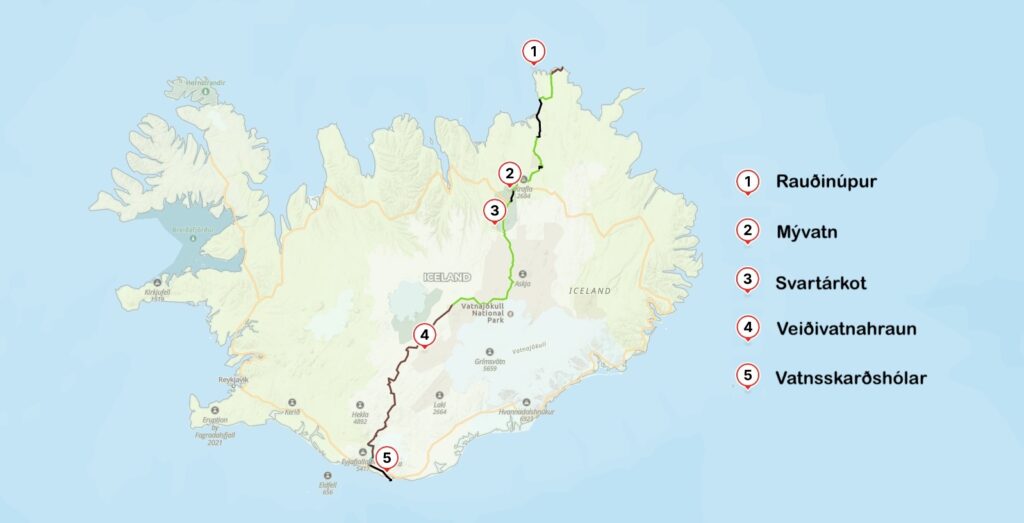
Recent weather and forecasts are available from the following stations. Links are available to the live weather station information.
The Veðurstofa Íslands (Icelandic Meteorological Office) was super kind and provided us with weather reports for five weather stations that we requested. They provided a 10 year summary, available at the links below, as well as daily and hourly data for the last 5 years.
Summary
For the daily data, we are able to establish the following high level summary.
| Station | Rauðinúpur | Mývatn | Svartárkot | Veiðivatnahraun | Vatnsskarðshólar | All Stations |
|---|---|---|---|---|---|---|
| Temperature (ºC) | ||||||
| Max-Max | 20 | 26 | 24 | 20 | 17 | 26 |
| Max-Average | 12 | 15 | 14 | 13 | 14 | 13 |
| Max-Min | 6 | 4 | 4 | 7 | 11 | 4 |
| Daily Average | 9 | 11 | 10 | 9 | 12 | 10 |
| Min-Max | 13 | 12 | 11 | 9 | 11 | 13 |
| Min-Average | 7 | 7 | 6 | 5 | 9 | 7 |
| Min-Min | 3 | 2 | 0 | 0 | 3 | 0 |
| Wind (kph) | ||||||
| Daily Average | 25 | 17 | 16 | 17 | 19 | 19 |
| Max-Max | 78 | 70 | 55 | 64 | 75 | 78 |
| Max-Average | 42 | 32 | 32 | 32 | 37 | 35 |
| Max-Min | 20 | 15 | 12 | 17 | 13 | 12 |
| Gusts-Max | 91 | 89 | 81 | 82 | 121 | 121 |
| Gusts-Average | 49 | 42 | 41 | 42 | 53 | 46 |
| Gusts-Min | 23 | 21 | 15 | 23 | 18 | 15 |
| % Days > 30 kph | 78% | 53% | 55% | 43% | 66% | 59% |
| % Days > 40 kph | 49% | 18% | 22% | 20% | 43% | 30% |
| % Days > 50 kph | 24% | 7% | 2% | 5% | 20% | 12% |
| Start Date | 6 Jul | 10 Jul | 14 Jul | 16 Jul | 1 Aug | 6 Jul |
| End Date | 14 Jul | 20 Jul | 24 Jul | 26 Jul | 8 Aug | 8 Aug |
The easiest way to think about the above is: It will never get warmer that 26ºC or colder than 0ºC, with a daily average of 10ºC. Wind is more complicated with the daily average of 19 kph, and daily sustained maximums never exceeding 78 kph with gusts up-to 121 kph. At 80 kph it would be hard to maintain balance and it would be better to seek shelter. So that does not sound great at all. Except at the coasts, the daily maximum wind is usually (2% to 7% of the days) less than 50 kph, which would likely feel quite strong and create an inconvenience, especially when walking against the wind.
I gave the same weather data to chatgpt along with our dates, and it summarized the weather as follows:
From July 6 to August 8 across the years 2020–2024, the historical weather data from your file reveals:
🌡️ Temperature
- Average daily temperature (T): 9.8 °C
- Average daily max (TX): 13.4 °C
- Average daily min (TN): 6.6 °C
- Warmest max observed: 26.2 °C
- Coldest min observed: –1.6 °C
🌬️ Wind
- Average wind speed (F): 5.3 m/s (19 kph)
- Average wind gust (FX): 9.6 m/s (34.5 kph)
- Maximum gust recorded: 29.4 m/s (106 kph)
- Maximum 10-minute mean: 22.5 m/s (81 kph)
💧 Humidity
- Mean relative humidity: 84.7%
- Range: 49% to 100%
🌧️ Precipitation (Note: very sparse data)
- Days with recorded rain: 34 (out of 816 rows)
- Average on rainy days: 2.9 mm
- Max recorded: 19.3 mm
This snapshot suggests that July–early August is relatively mild with potential for strong wind gusts. You should be prepared for wind-exposed trekking days, and occasional chilly nights, especially if camping high or exposed.
Reports
So, here is how these reports seem to work. There is metadata, temperature, wind and sometimes rain in the report. Not all stations measure rain, as apparently rain is hard to measure. Below are some examples and extracts from the report.
Metadata
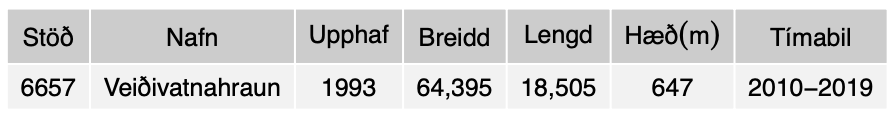
The report will always include the metadata, which is the station identifier, its name, when it started to be operational, latitude, longitude, height above sea level and period of report.
Temperature
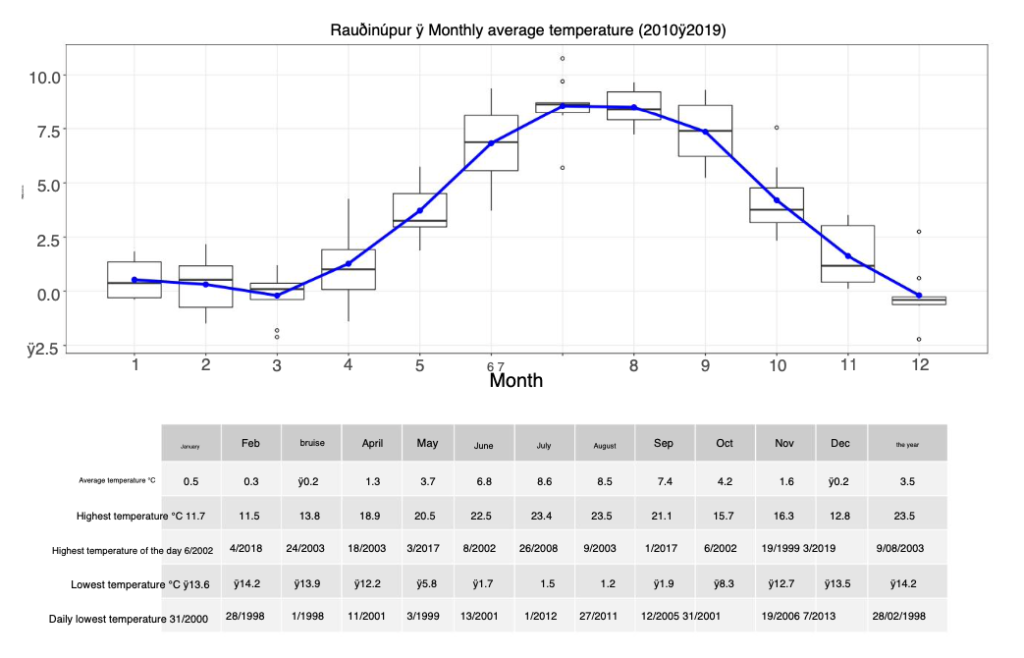
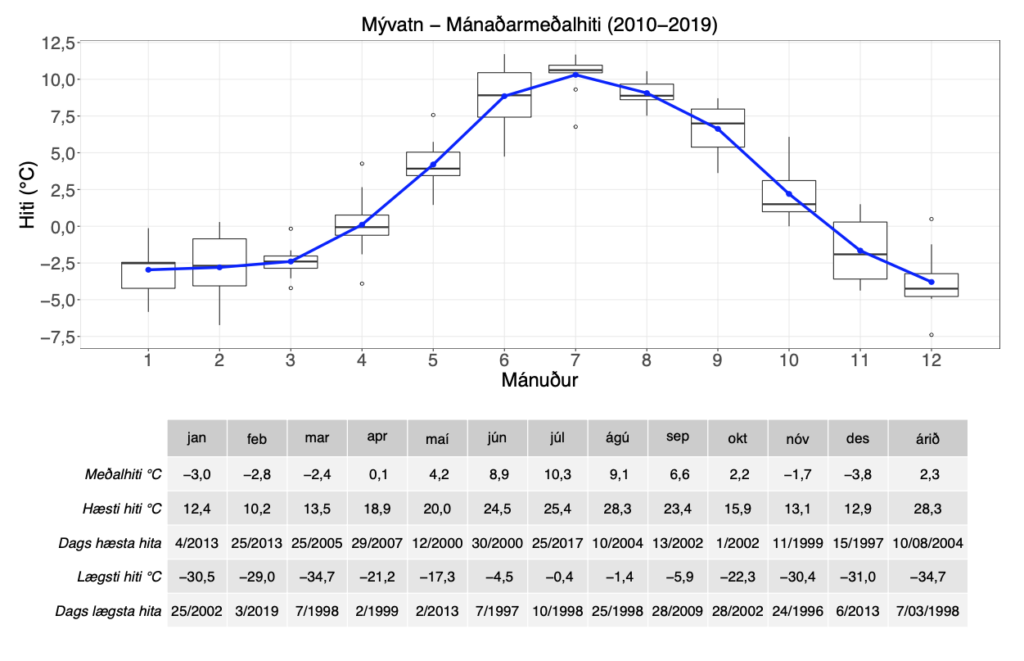
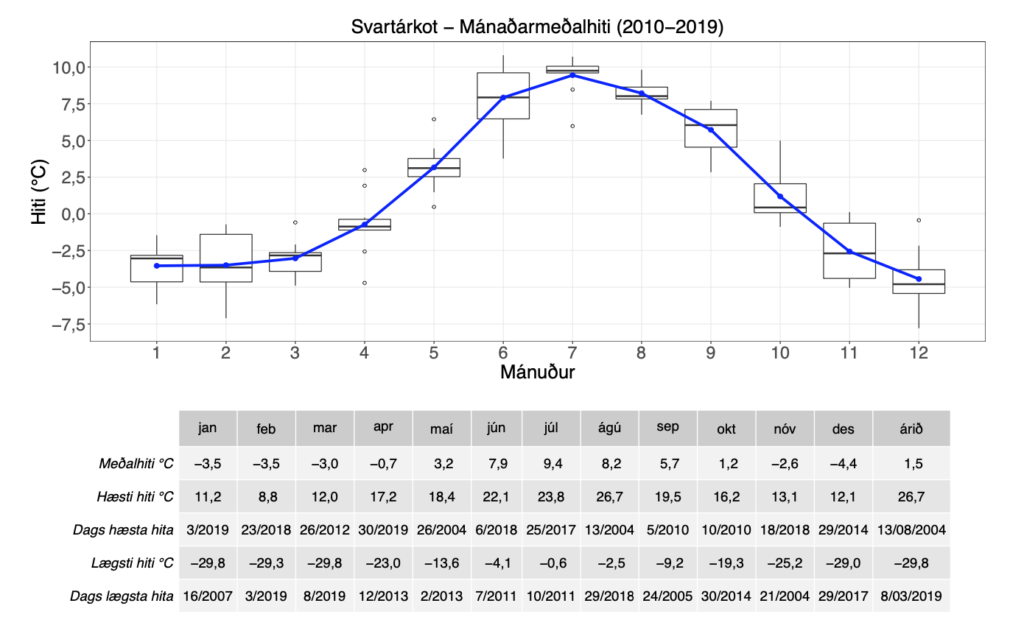
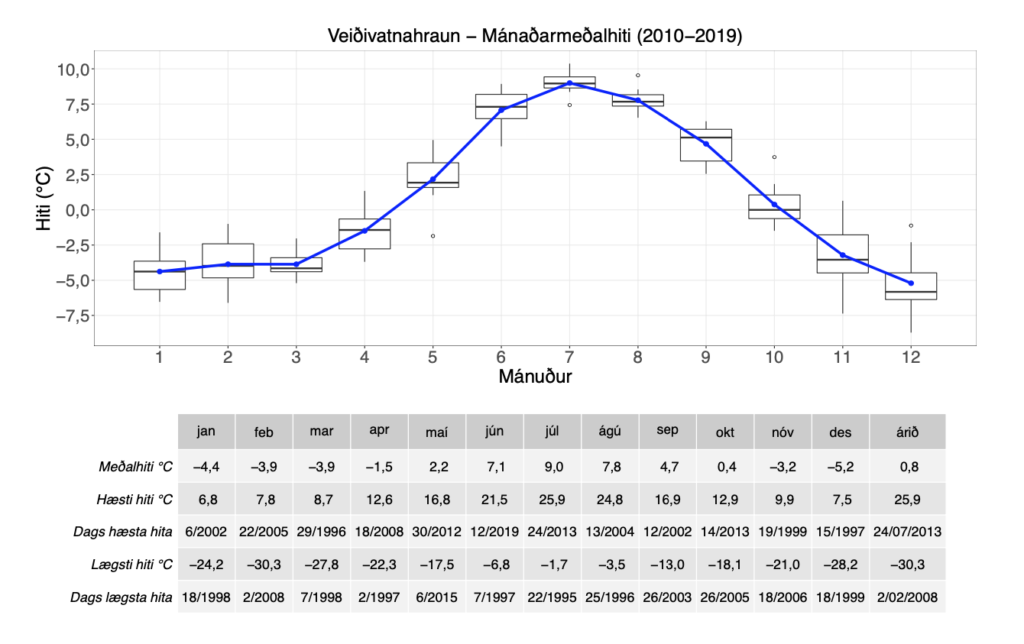
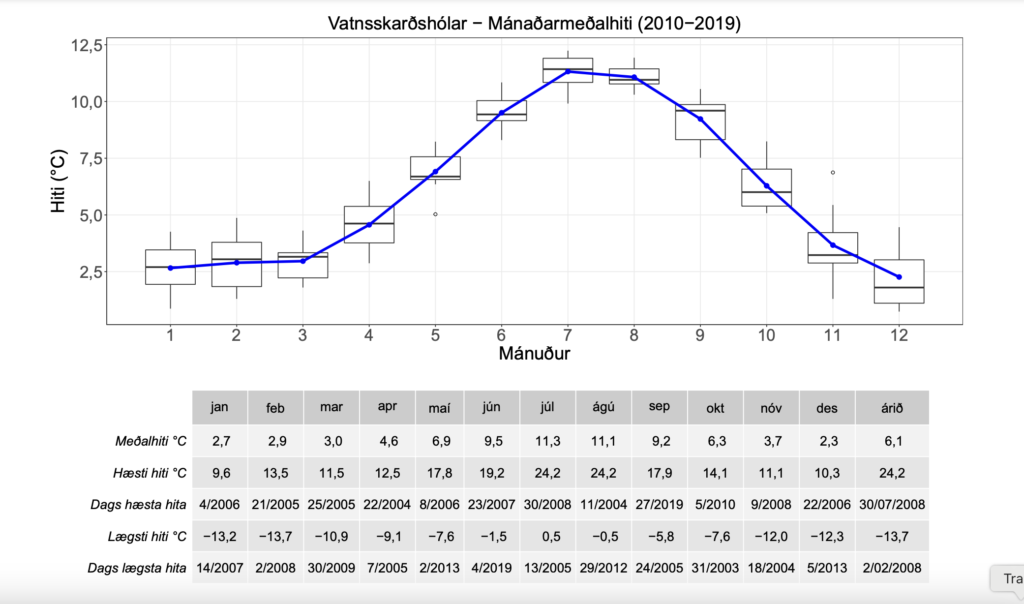
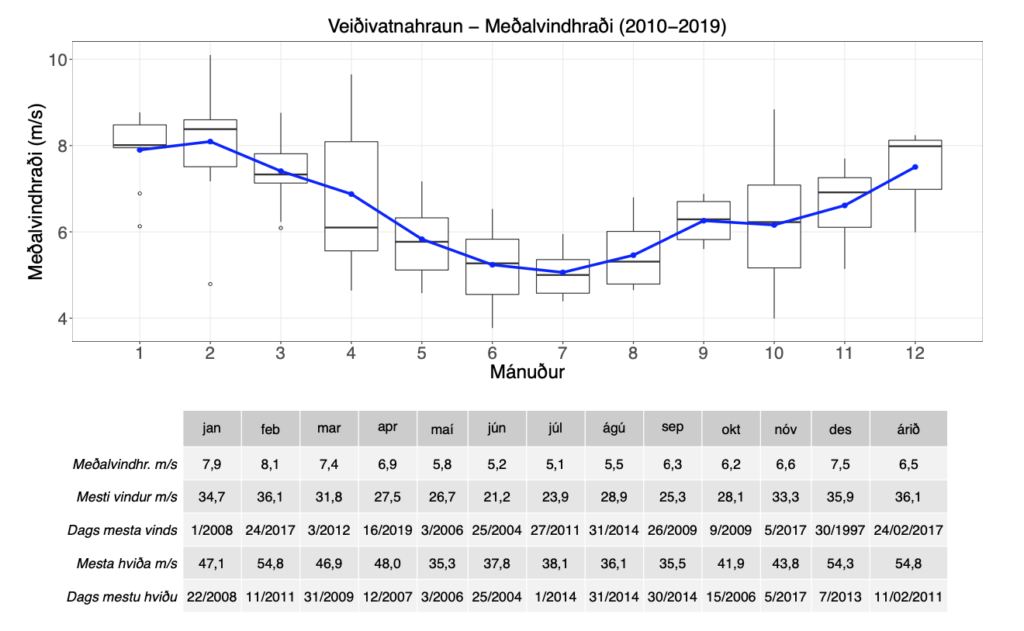
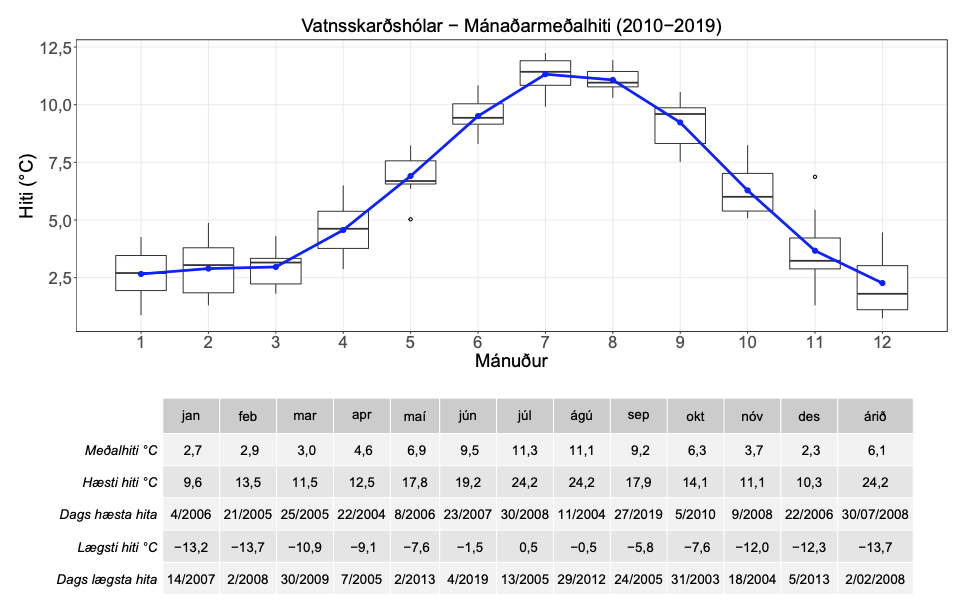
The reports all include temperature. The charts below show the seasonal temperature variation (°C) by station. The box plots are based on monthly averages from 2010 to 2019. The crossbar of each box shows the median value, with 50% of the values (25%-75%) within the box. The vertical lines show outliers that are no further away from the box than 150% of its size. Outliers that fall outside these limits are shown as a circle. The blue dots and the line between them show the 10-year average for each calendar month, the values can be found in the table associated with the chart. These tables also shows the highest and lowest temperatures for each month, along with the date (day/year). The outliers are found for the entire period of measurements at the station. Only the most recent date is given if the outlier occurs more than once.
The following few tables summarize the information from the charts and associated tables. We are only interested in the months of July and August, as this is when we will be doing our walk. The first table below summarizes the months of interest for us and effectively shows the extreme range of temperatures likely to be encountered on our planned trip.
| Temperatures | Station 1 | Station 2 | Station 3 | Station 4 | Station 5 | All Stations |
|---|---|---|---|---|---|---|
| Average | 8.5 | 9.7 | 8.8 | 8.4 | 11.2 | 8.8 |
| 10 year High | 23.5 | 28.3 | 26.7 | 25.9 | 24.2 | 28.3 |
| 10 year Low | 1.2 | -1.4 | -2.5 | -3.5 | -0.5 | -3.5 |
The following table presents the average temperature and the range where 50% of the daily averages will typically fall within, for the months of July and August. A small range indicates less daily variability. The average daily temperature is calculated by taking the average lowest temperature added to the average highest temperature and dividing the result by 2. It is not the average high or average low for the day, which would be more useful.
| Temperatures | Station 1 | Station 2 | Station 3 | Station 4 | Station 5 |
|---|---|---|---|---|---|
| -25% | 8.2 / 7.9 | 10.3 / 8.5 | 9.5 / 7.8 | 8.6 / 7.3 | 10.7 / 10.6 |
| Average | 8.6 / 8.4 | 10.3 / 8.9 | 9.3 / 8.3 | 8.9 / 7.8 | 11.0 . 10.8 |
| +25% | 8.7 / 9.1 | 10.9 / 9.5 | 10.0 / 8.5 | 9.4 / 8.0 | 11.5 / 11.1 |
| 50% Range | 0.5 / 0.7 | 0.6 / 1.0 | 0.5 / 0.7 | 0.7 / 0.7 | 0.8 / 0.5 |
The following charts and tables are from Veðurstofa Íslands (Icelandic Meteorological Office).
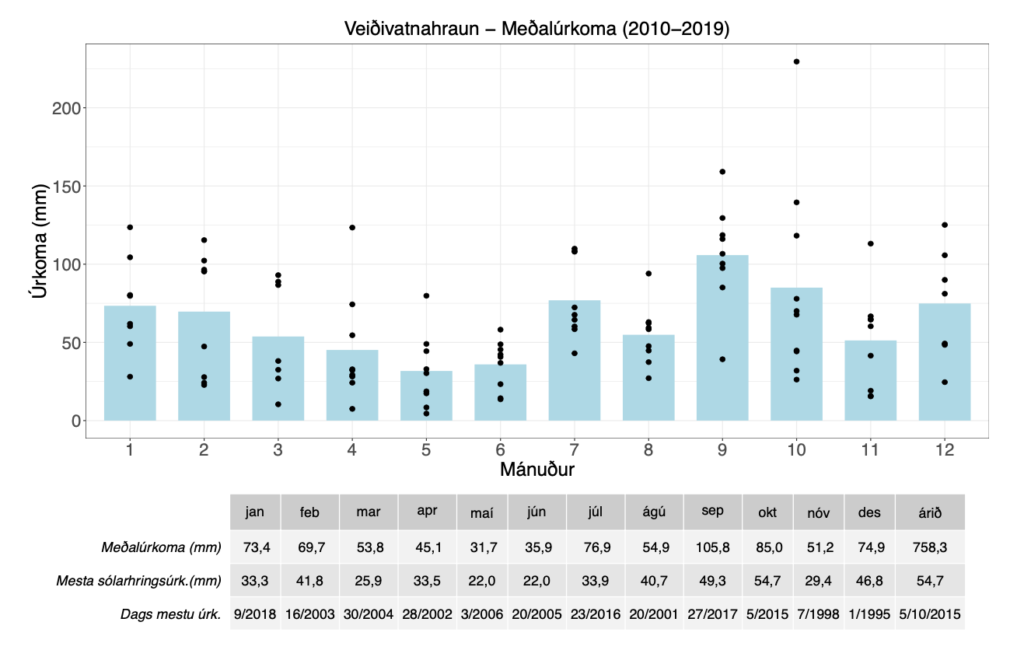
Rainfall
Only the Station 4 report includes rainfall. The charts below show the seasonal variation of precipitation (mm) during the period 2010 to 2019. The blue bars show the average precipitation for each month. The black dots show the total precipitation for all months during the period. The tables shows the monthly average for each calendar month. It also shows the highest precipitation that has fallen in a single 24-hour period along with the date (day/year). The highest 24-hour precipitation is found for the entire period of measurements at the station. Only the most recent date is given if the value occurs more than once.
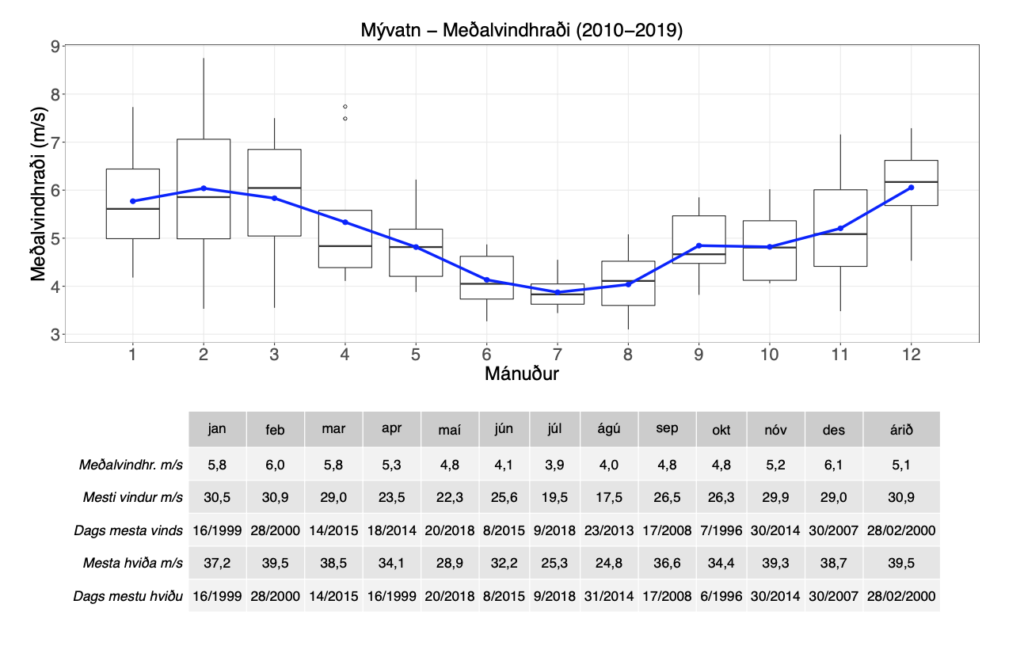
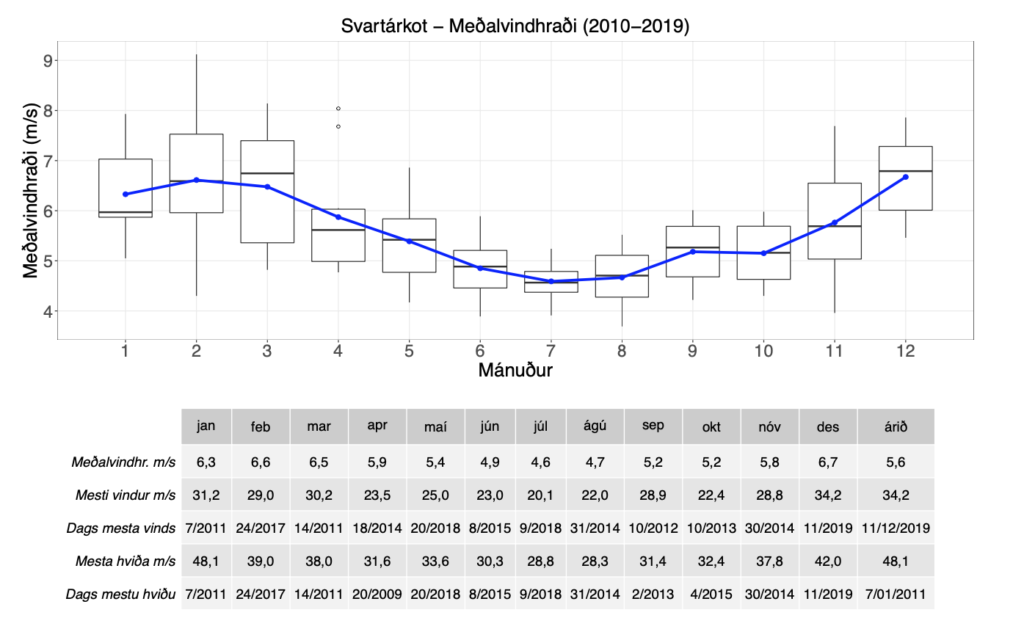
Wind Speed
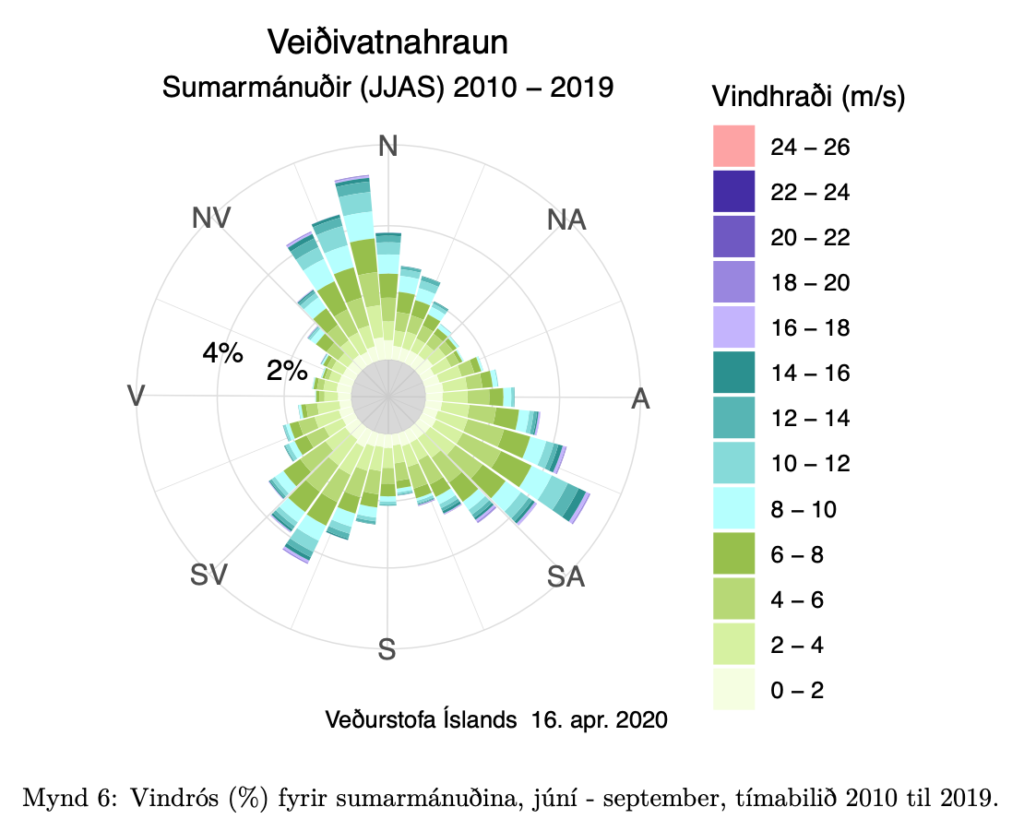
The reports all include wind speed. The charts below show the average wind speed (m/s) for each calendar month. The box plots are based on monthly averages from 2010 to 2019. The crossbar of each box shows the median value, with 50% of the values (25%—75%) within the box. The vertical lines represent outliers that are no further from the box than 150% of its size. Outliers that fall outside these limits are shown as a circle. The blue dots and the line between them show the 10-year average for each calendar month, the values can be found in a table. The tables also shows the highest wind speed and highest gust for each month, along with the date (day/year). The outliers are found for the entire period of measurements at the station. Only the most recent date is given if the outlier occurs more than once.
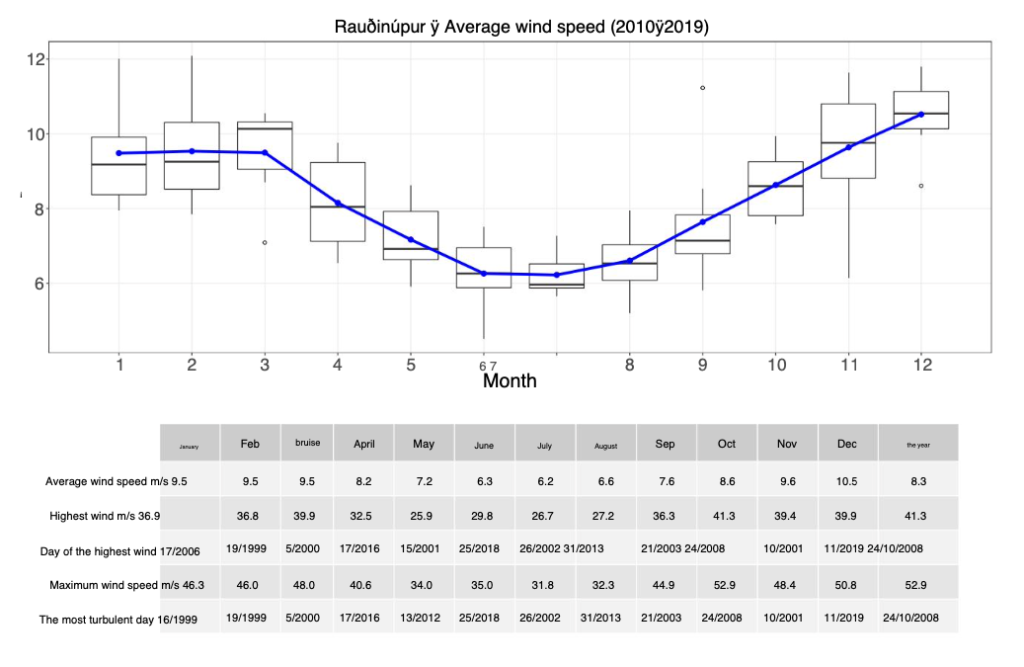
The reports also include a selection of wind roses. The one below is an example for the wind during summer.